Introducing
About me
Gregor Aisch
visualization architect
Why do we need (yet) another mapping framework?
Outlining the problems of existing frameworks.
Mercator is bad
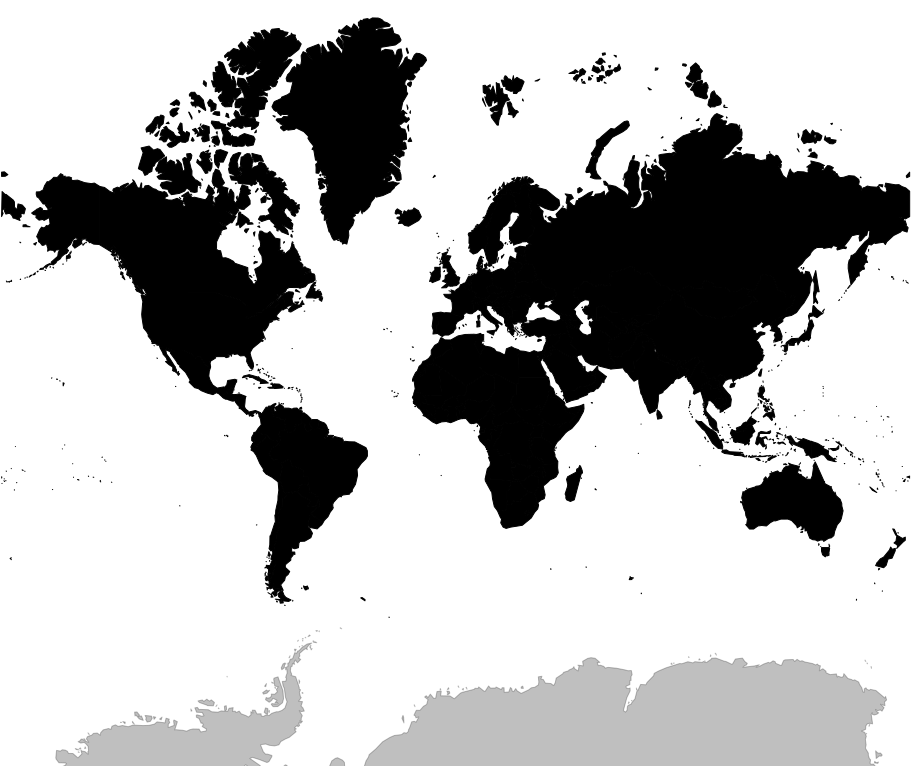
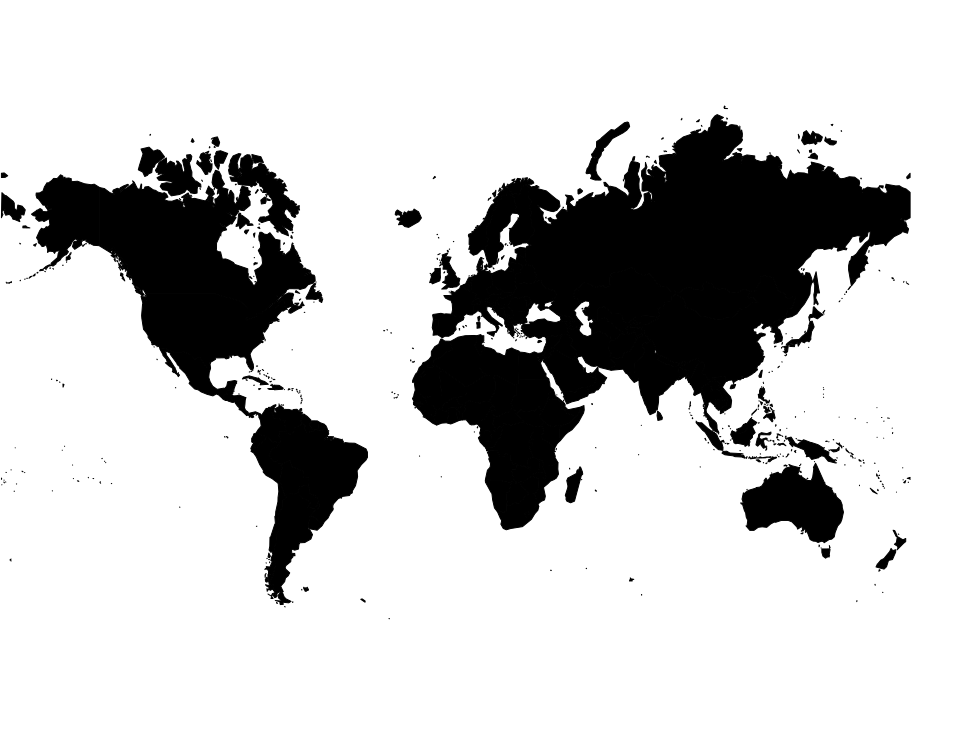
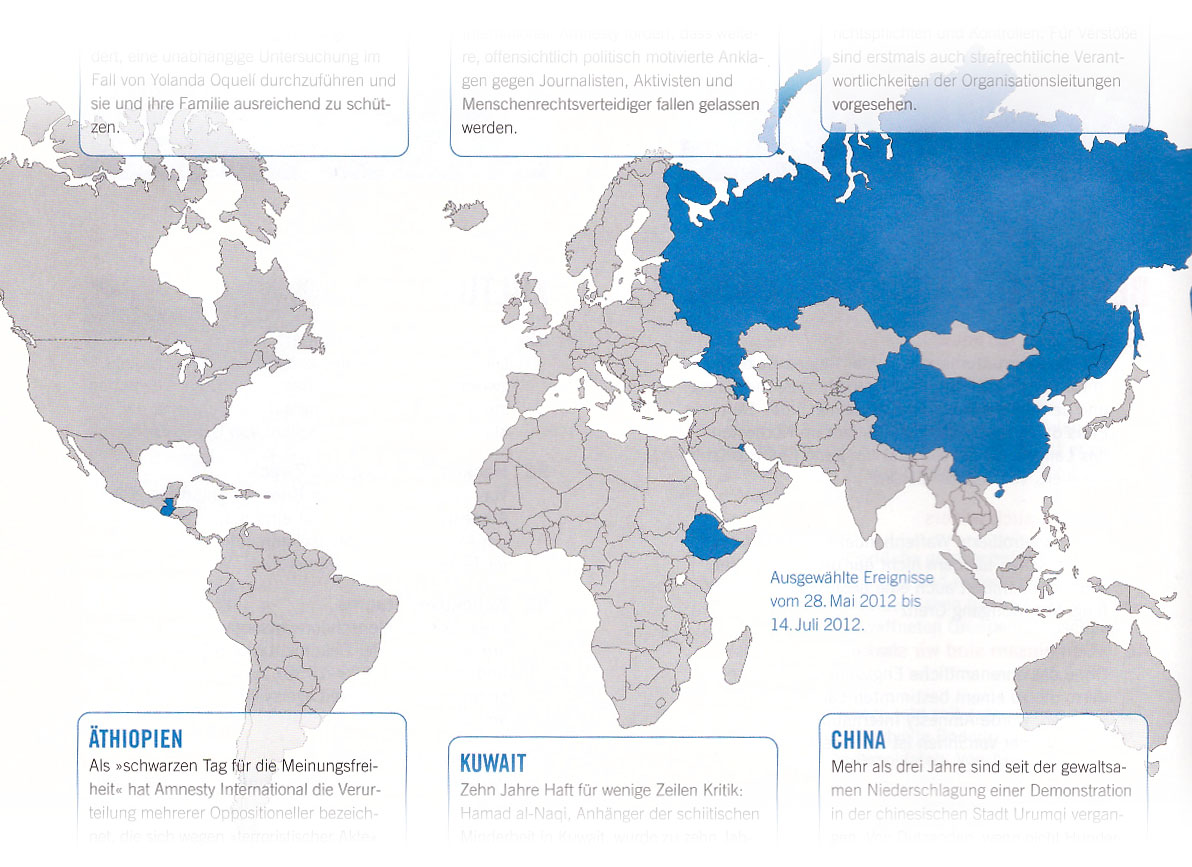
Source: Amnesty International Journal, German
Some maps need focus
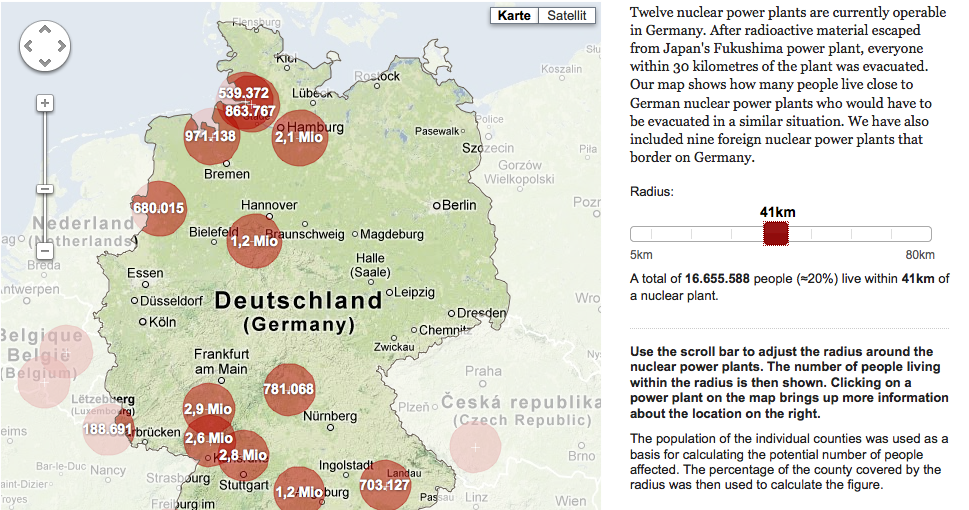
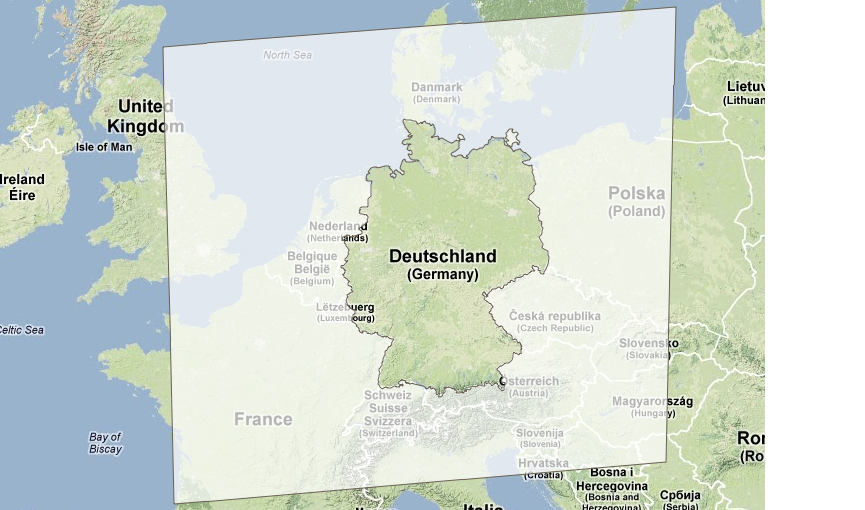
Source:
zeit.de
Some maps don't need to show every detail

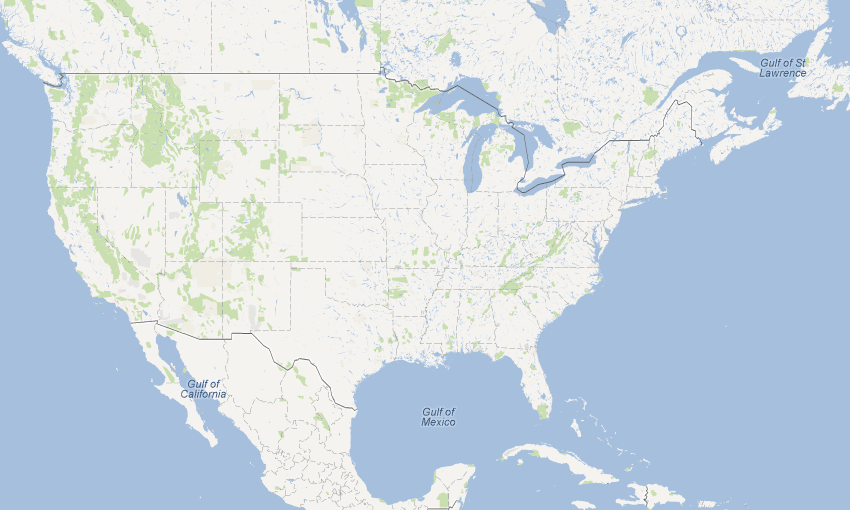
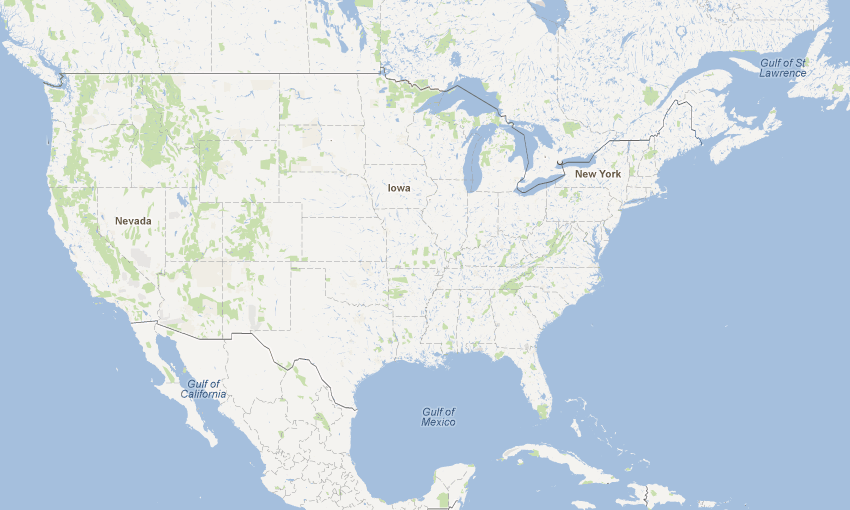
Source: Google Maps
Some maps need to fit
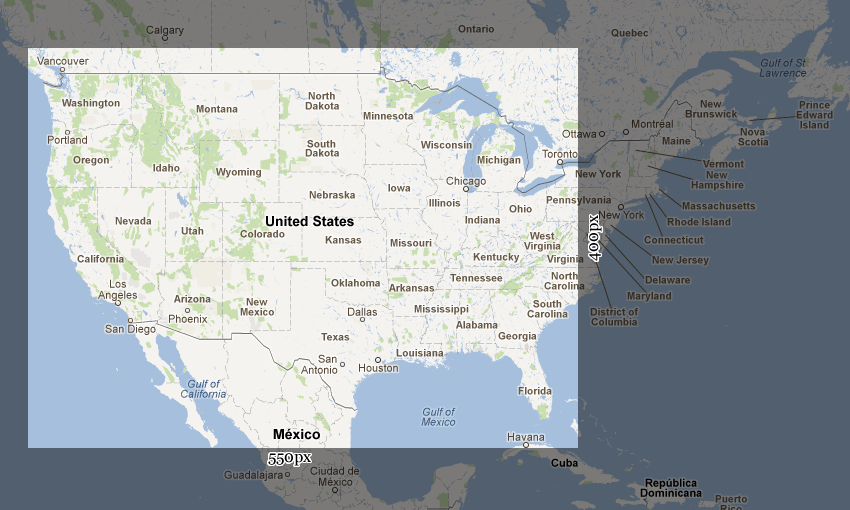
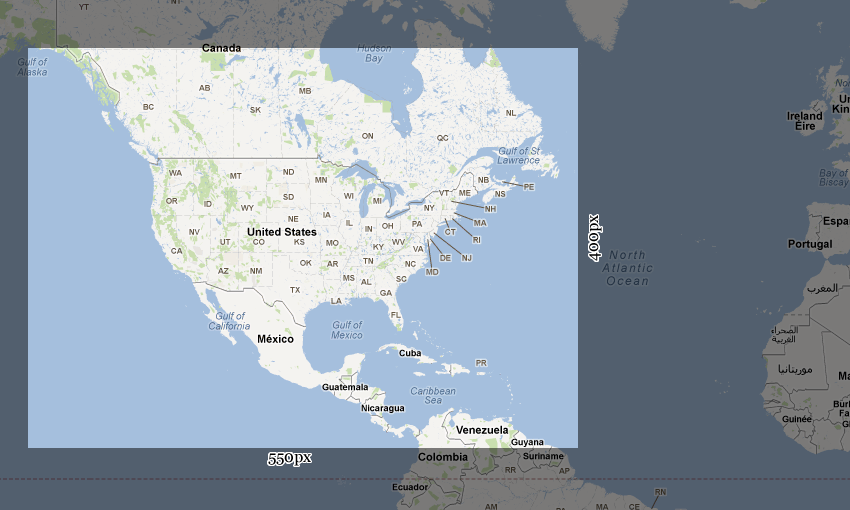
Source: Google Maps
Vector mapping using OpenLayers is hard
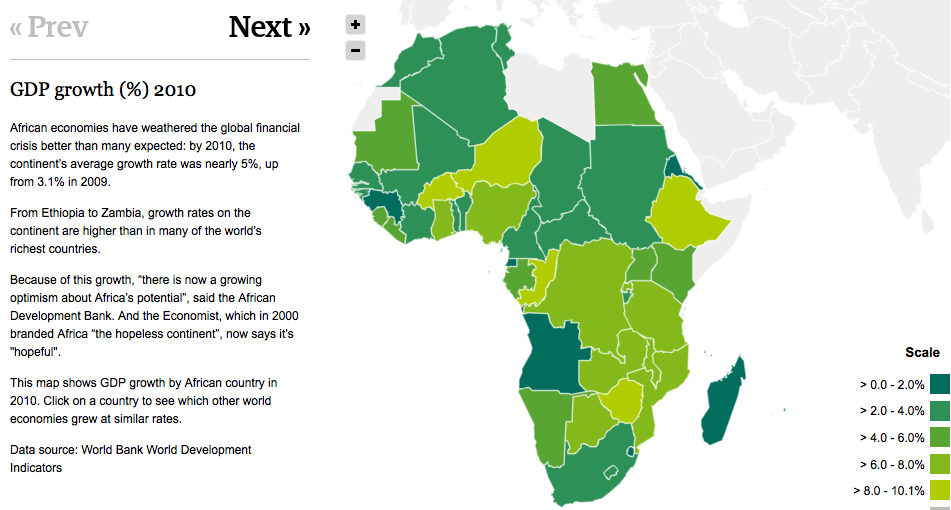
Source:
guardian.co.uk
Hack it yourself
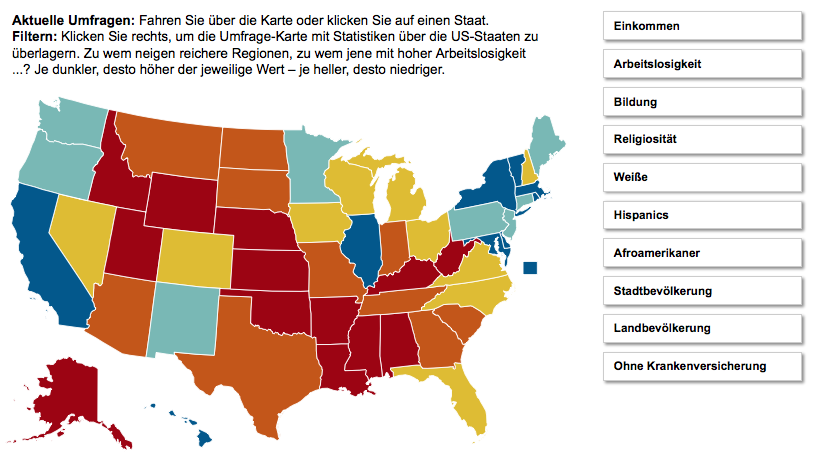
Source:
sueddeutsche.de
, Maximilian Ruppert
Many SVGs you find have no meta data
<path id="path_0" d="M..." >
<path id="path_1" d="M..." >
<path id="path_2" d="M..." >
<path id="path_3" d="M..." >- Many SVG maps are rendered using Cairo SVG renderer
- Mapnik, QGis, etc.
- E.g. most of the maps you find on Wikipedia
Kartograph.py
A Python library for rendering SVG maps
JSON/YAML configuration file
{
   "proj": {
      "id": "ortho",
      "lon0": -70
   },
   "layers": {
      "countries": {
         "src": "ne_50m_admin_0_countries.shp",
         "attributes": ["ISO_A3", "NAME"]
      }
   },
   "bounds": {
      "mode": "bbox",
      "data": [-130, -13, -20, 50]
   }
}
Shapefile:
naturalearthdata.com
Command line interface
                    ❯ kartograph

                        cfg.json

                    -o

                        map.svg
Use as Python module
import json
config = json.loads(open('cfg.json').read())

from kartograph import Kartograph
map = Kartograph()
map.generate(config, outfile='map.svg')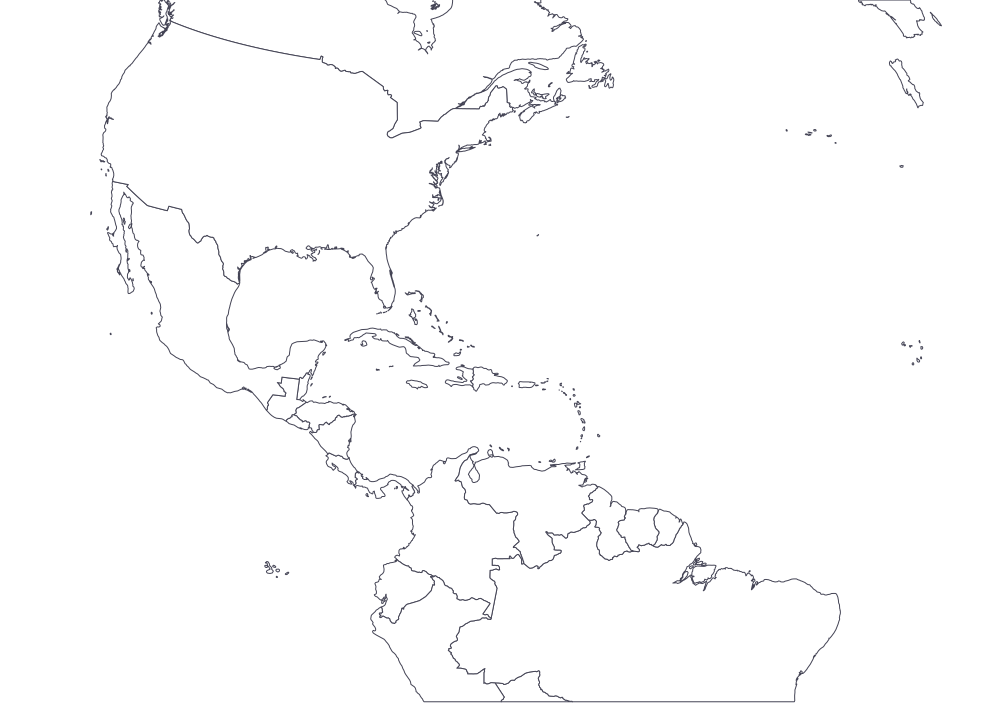
Map projections!
SVG markup designed for easy re-use
<svg version="1.1" width="1000px" >
    <metadata>
        <views>
            <view h="703.774294745" padding="0" w="1000">
                <proj id="ortho" lat0="18.5" lon0="-70"/>
                <bbox h="1146.98" w="1632.07" x="133.97" y="375.52"/>
            </view>
        </views>
    </metadata>
    <g id="countries" fill="#fff" stroke="#445">
        <path data-iso-a3="AIA" data-name="Anguilla" d="M531.638262,446.550195L531.506140,446.247885L530.866491,445.322468L530.220486,444.828711L530.056471,445.009542L529.897194,445.541638L530.543309,446.035446L531.189694,446.693618L531.674487,446.858025L531.638262,446.550195Z "/>
        <path data-iso-a3="BHS" data-name="Bahamas" d="M601.400517,383.682286L601.600934,383.214998L601.131317,383.180271L599.877174,383.970704L599.821496,384.281517L601.400517,383.682286Z "/>
        <path data-iso-a3="BOL" data-name="Bolivia" d="M614.872057,395.769952L615.079679,395.632789L615.156100,395.406155L615.147550,395.100623L614.920650,395.040445L614.598909,394.698008L613.790649,394.409806L613.116436,395.196961L613.183103,395.567778L613.431569,396.088819L614.565680,396.209820L614.872057,395.769952Z M614.313216,390.046643L614.248151,389.126144L613.961161,388.827808L613.523460,388.779889L613.187949,388.611234L613.054265,388.721416L613.036915,388.924078L613.329034,389.865220L614.175131,390.333570L614.313216,390.046643Z "/>
        <path data-iso-a3="BRA" data-name="Brazil" d="M500.463726,353.091910L500.636307,351.951965L500.174012,351.796448L499.368152,352.940875L498.382225,353.460459L497.724408,353.430345L496.512678,352.921464L495.530241,353.019426L494.898880,353.698949L493.945998,353.921263L494.047927,354.148589L494.060334,354.368856L493.858799,354.924446L493.906848,355.283593L494.097564,355.695006L496.689676,355.676273L499.049558,355.343144L500.131367,353."/>
        ...
     </g>
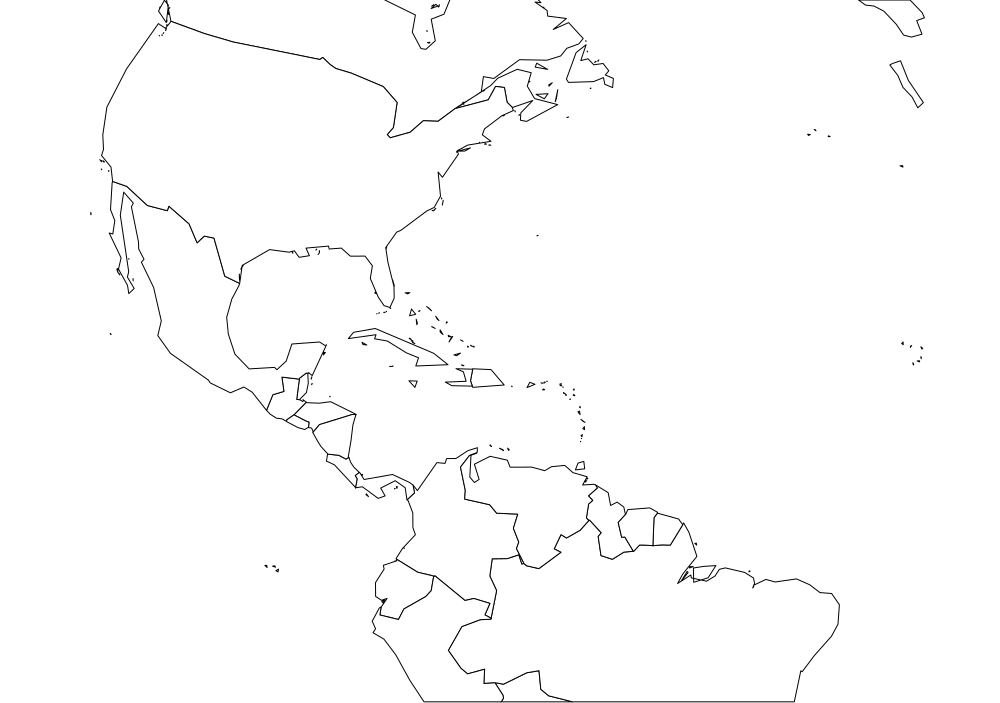
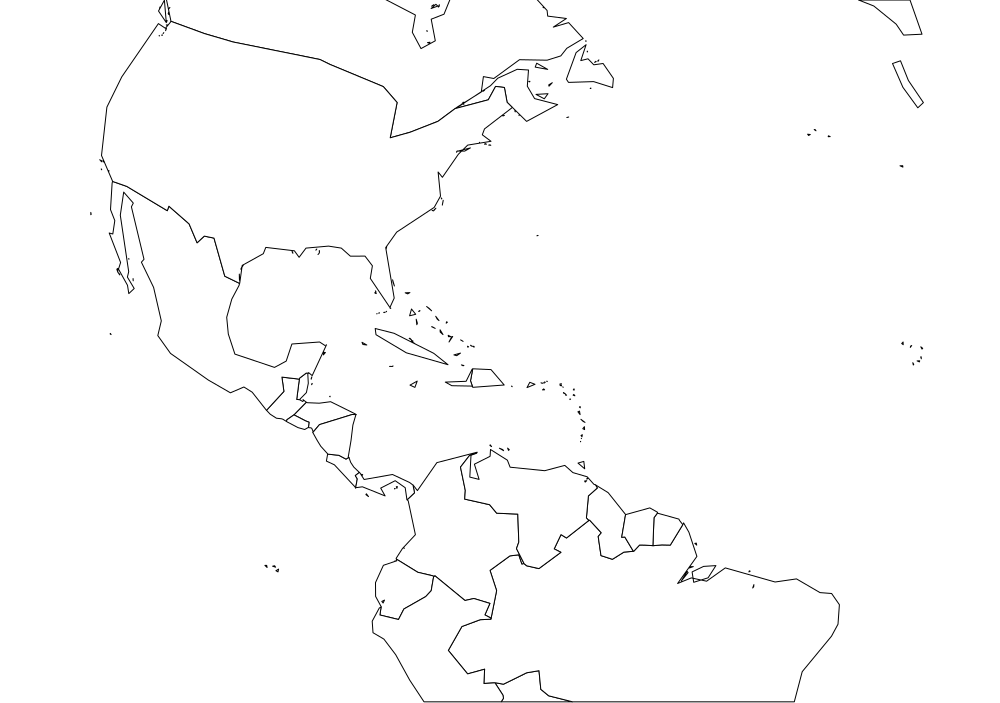
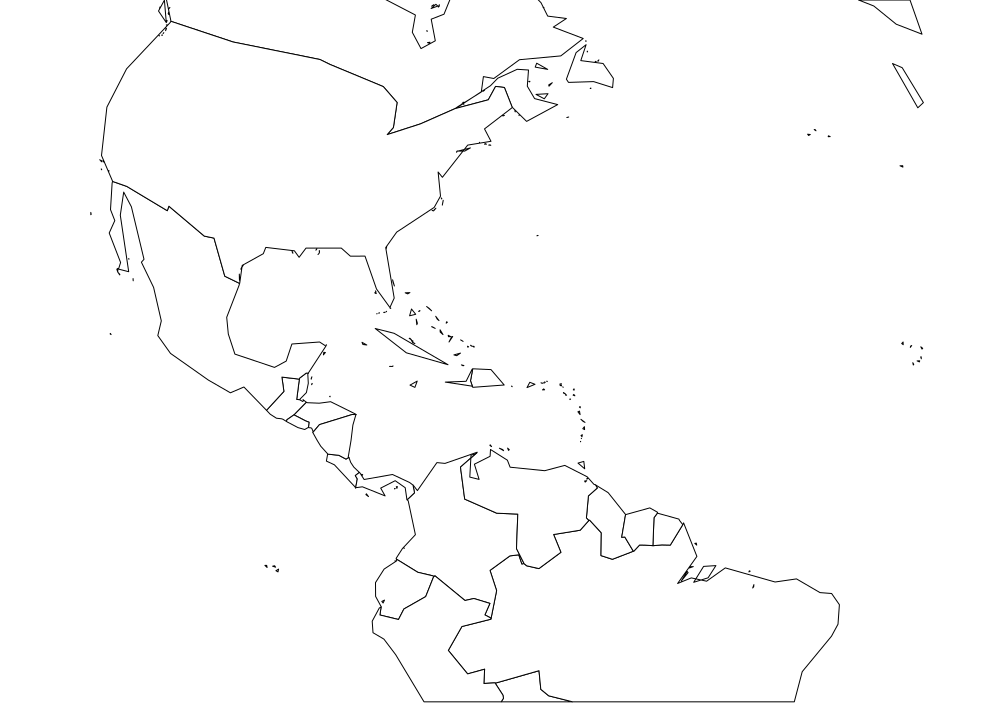
</svg>Keep your SVGs small
"layers": {
   "countries": {
      "src": "ne_50m_admin_0_countries.shp",
      "simplifiy": 2
   }
},
"export": {
   "width": 1000,
   "round": 1
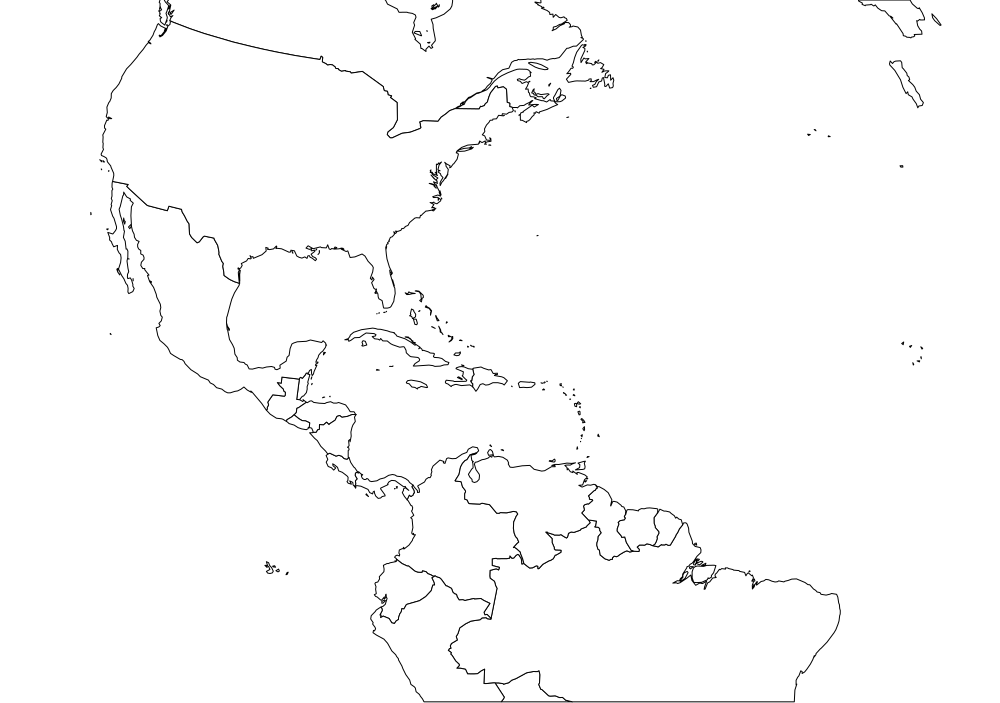
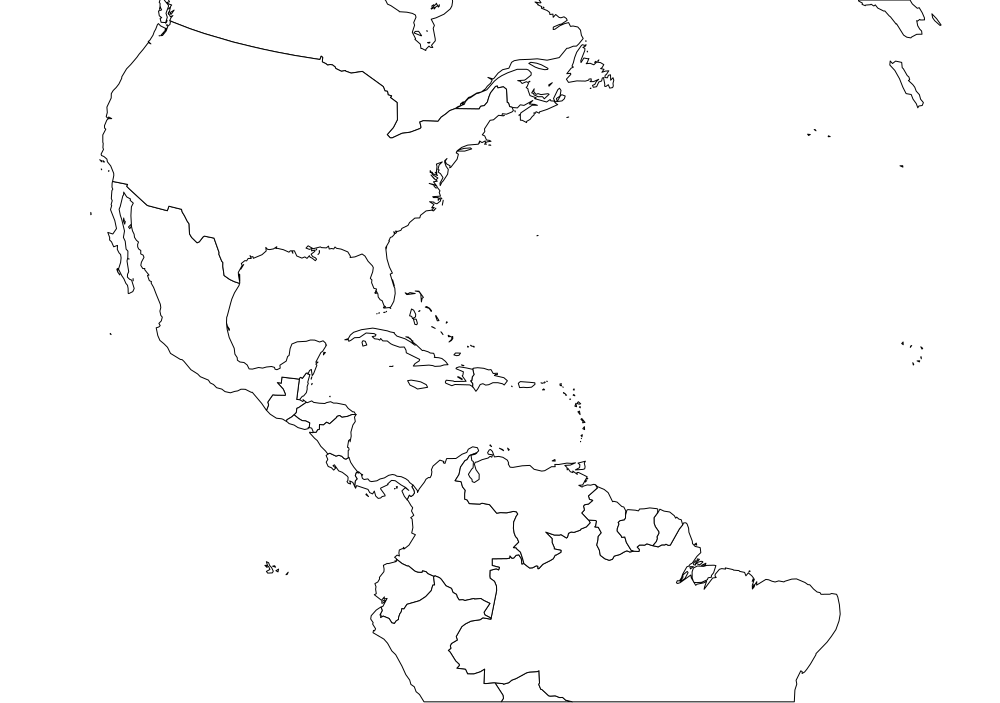
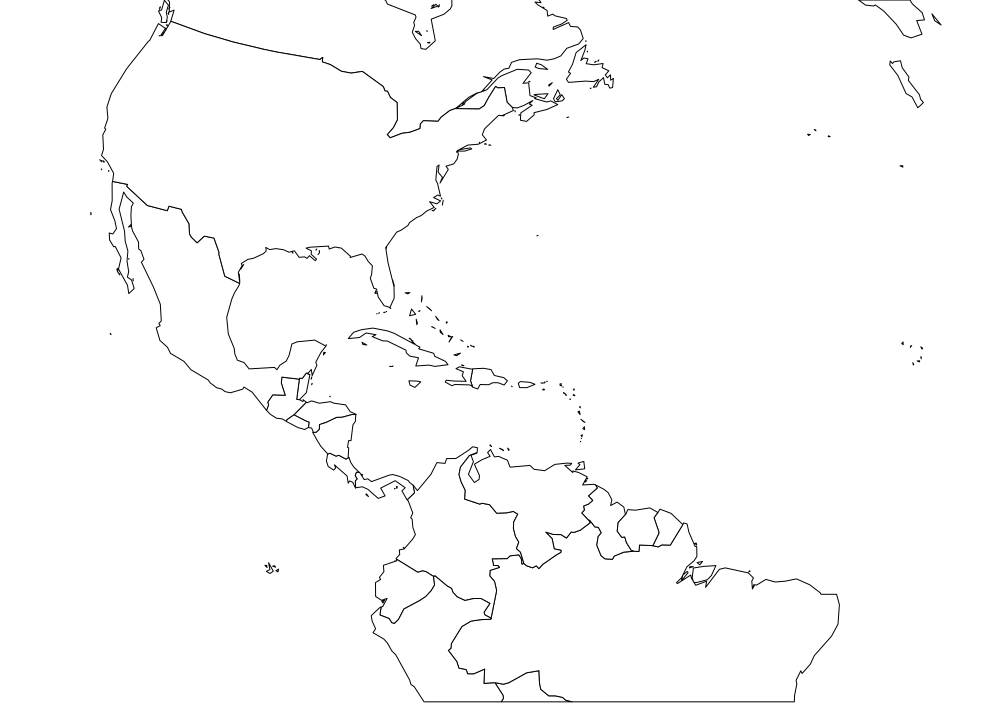
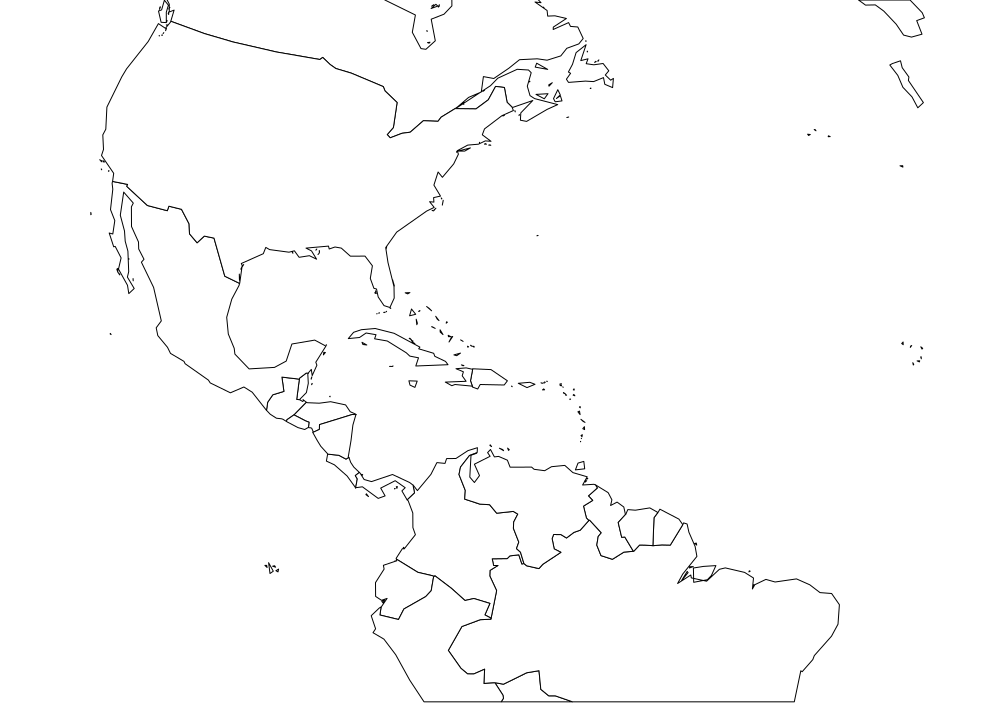
}- Reduce the resolution of your map using simplification
- Cut of digits after decimal point
- Serve your SVGs compressed
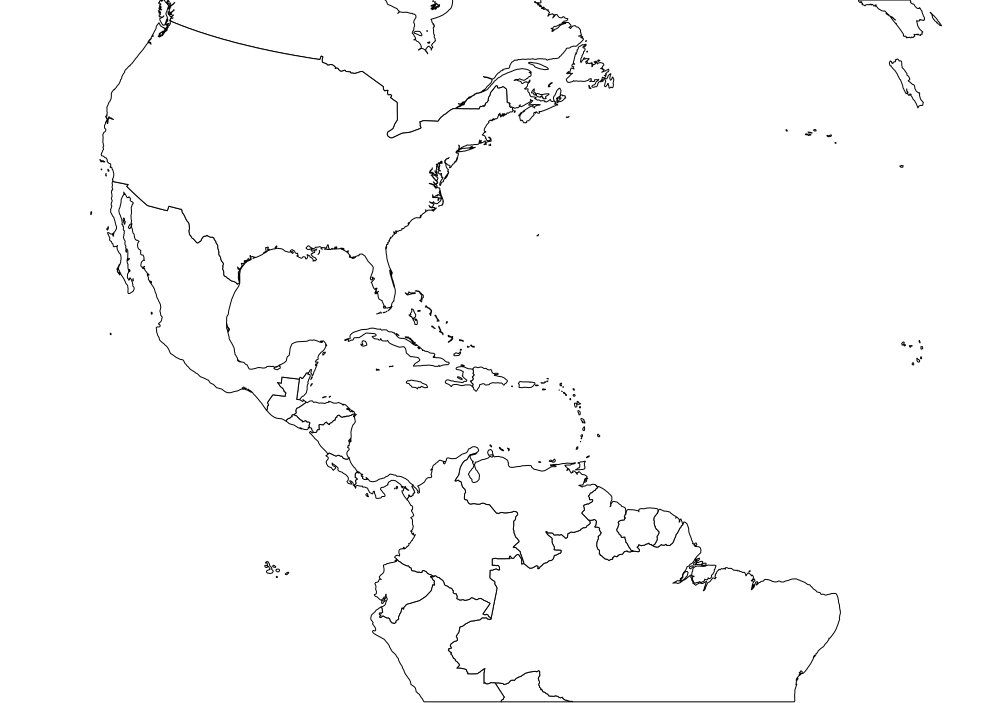
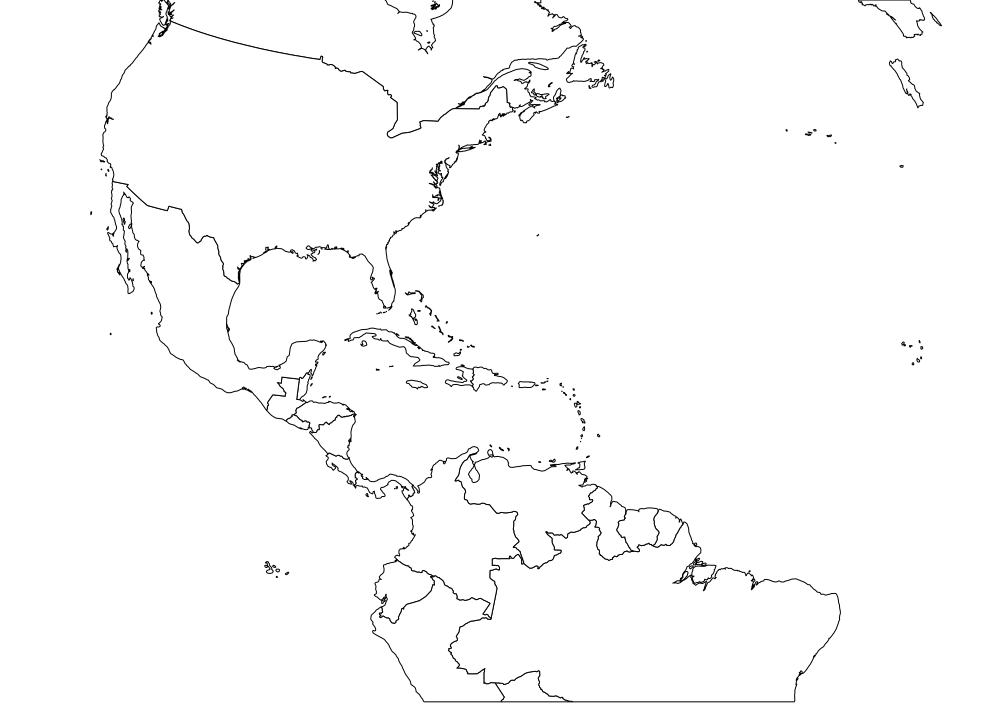
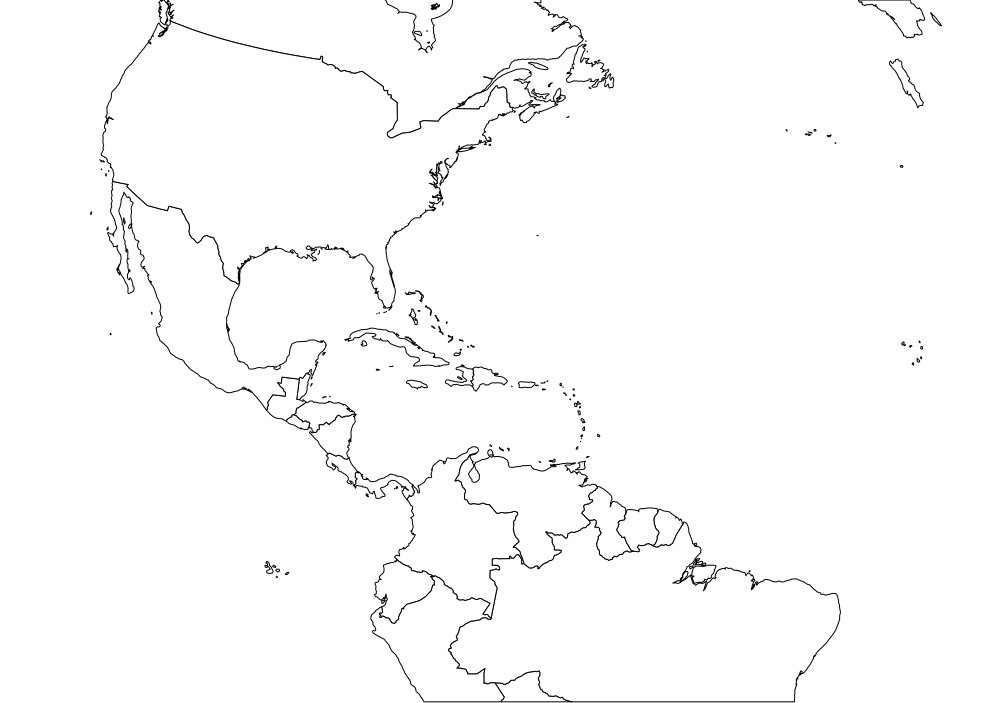
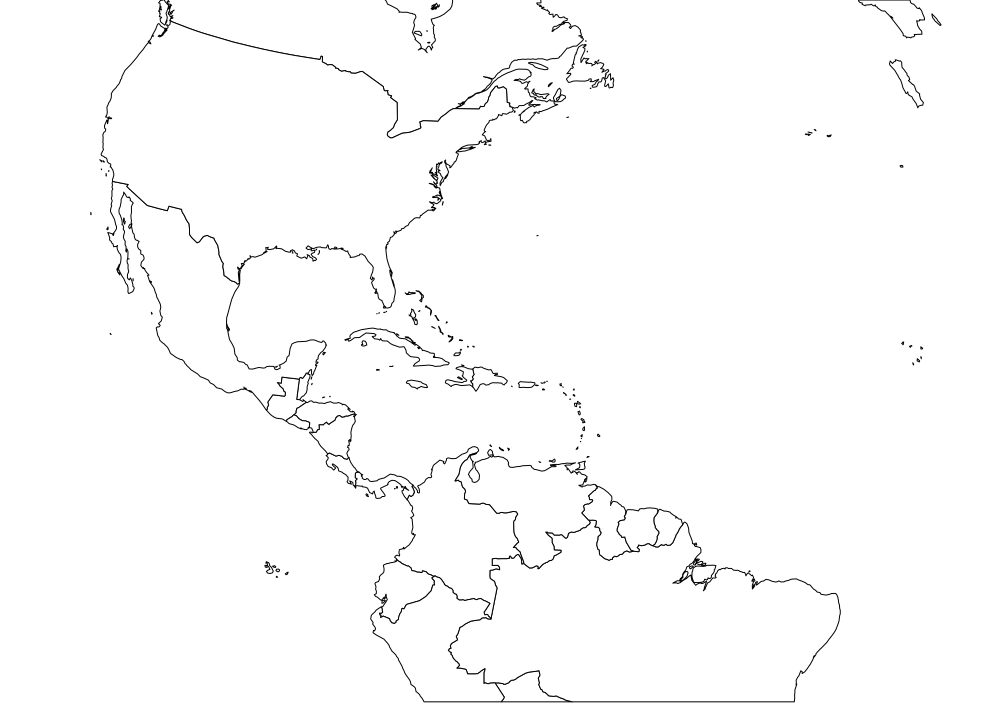
Cutting out map features
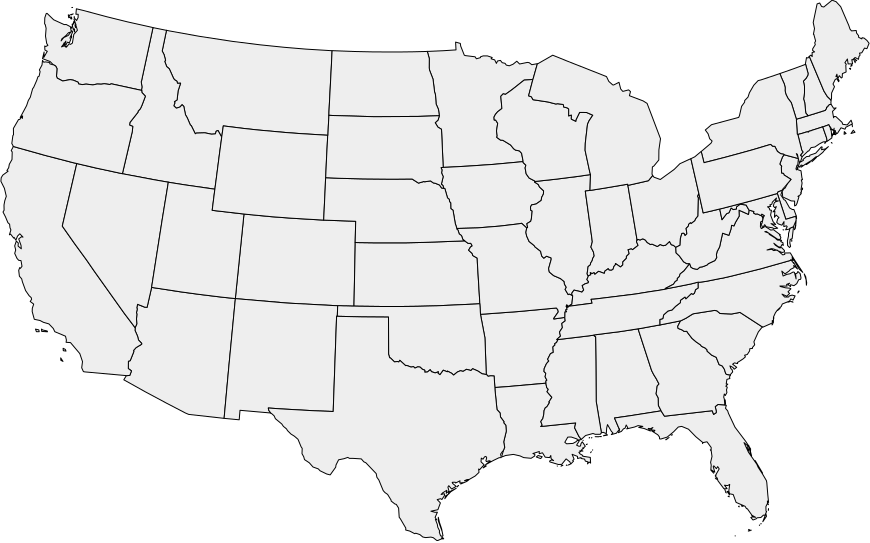
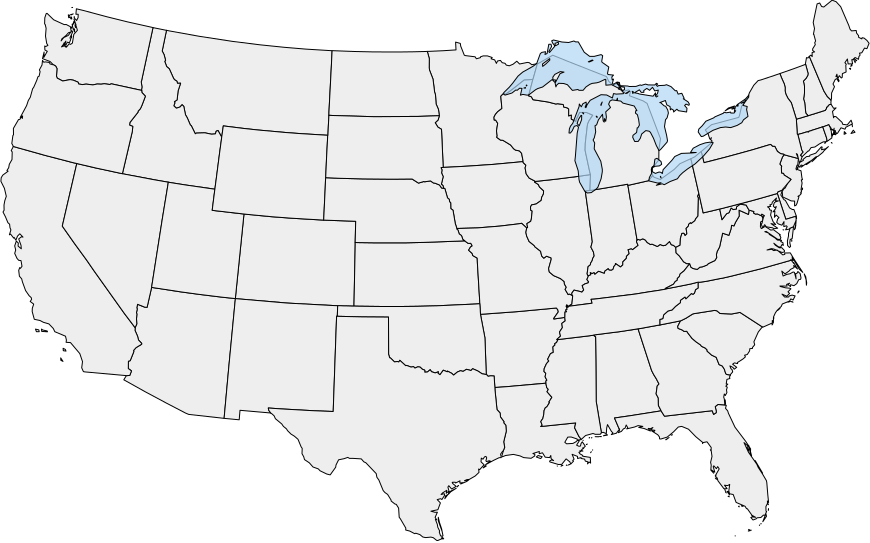
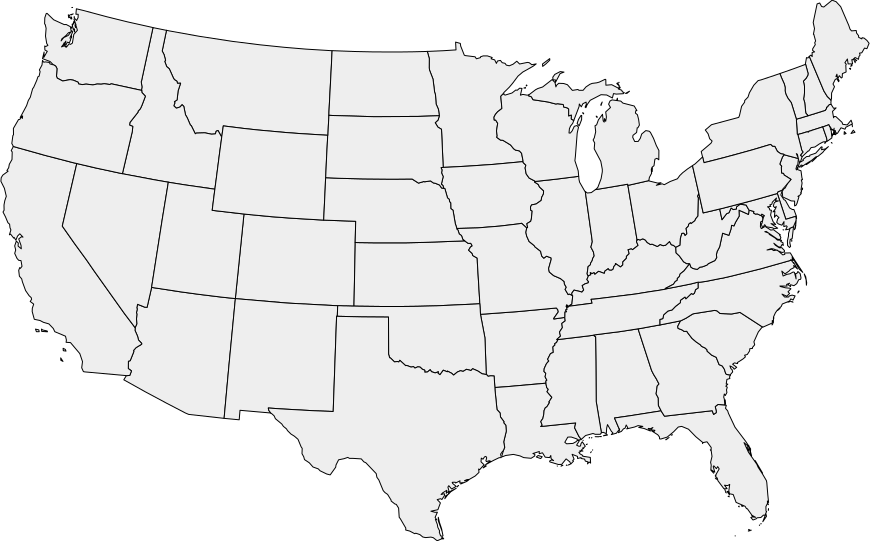
Shapefiles:
naturalearthdata.com
, Howto:
kartograph.org
Loading PostGIS data
"layers": {
    "urban": {
        "src": "postgis:dbname=osm",
        "table": "planet_osm_polygon",
        "query": "landuse IN ('residential', 'retail', 'industrial', 'garages', 'commercial', 'cemetery', 'allotments')",
        "join": { "buffer": 2 },
        "simplify": 2
    },
    "roads-primary": {
        "src": "postgis:dbname=osm",
        "table": "planet_osm_roads",
        "query": "highway like 'primary%'",
        "attributes": ["name"],
        "simplify": 1
    }
}
Source: https://gist.github.com/3082969
Styling maps using CSS
#rivers {
    stroke: #95C8E5;
    fill: none;
    opacity: 0.8;
}
#roads {
    fill: none;
    stroke: #AA9E91;
    stroke-width: 0.34px;
}
#roads[highway=primary] {
    stroke-width: 1px;
}
kartograph -s styles.css config.json
SVG map of Berlin
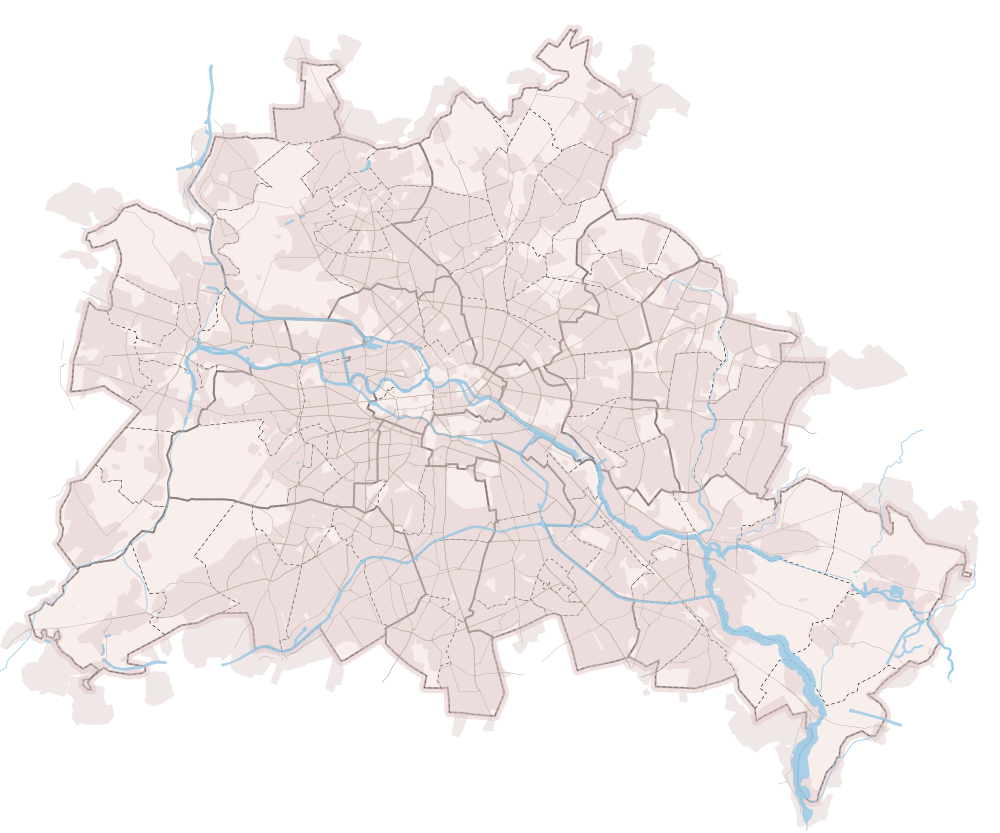
Map data © OpenStreetMap contributors, CC-BY-SA
Next step: turning SVG into interactive maps
- Load the SVG using jQuery $.ajax
- Parse it layer by layer
- Use a framework like RaphaelJS to render the geometries across browsers
- Color map features, add labels, symbols, etc
- Add mouse event handlers, tooltips, etc.
Kartograph.js
A JavaScript library for rendering SVG maps
(build on top of RaphaelJS and jQuery)
Simple, familiar looking JavaScript API
var map = Kartograph.map('#map');
// load your svg
map.loadMap('usa.svg', function() {
   // add layers
   map.addLayer('states', {
      // some styling
      styles: {
         fill: '#eee'
      },
      // some mouse events
      mouseenter: function(data, path) {
         $('h1').html(data.name);
         path.attr('fill', 'red');
         path.animate({ fill: '#eee' }, 1000);
      }
   });
});
Live Demo
Choropleth maps
var map = Kartograph.map('#map');
var poverty = { AK: 0.124, AZ: 0.186, AR: 0.155, CA: 0.163, CO: 0.122, CT: 0.083, DE: 0.121, DC: 0.199, FL: 0.16, GA: 0.187, HI: 0.121, ID: 0.14, IL: 0.141, IN: 0.163, IA: 0.103, KS: 0.143, KY: 0.177, LA: 0.216, ME: 0.125, MD: 0.108, MA: 0.106, MI: 0.155, MN: 0.105, MS: 0.227, MO: 0.148, MT: 0.14, NE: 0.102, NV: 0.164, NH: 0.066, NJ: 0.107, NM: 0.186, NY: 0.16, NC: 0.174, ND: 0.122, OH: 0.153, OK: 0.163, OR: 0.142, PA: 0.122, RI: 0.136, SC: 0.17, SD: 0.132, TN: 0.167, TX: 0.184, UT: 0.1, VT: 0.108, VA: 0.107, WA: 0.115, WV: 0.169, WI: 0.099, WY: 0.096 };
// load your svg
map.loadMap('usa.svg', function() {
   // add layers
   map.addLayer('states', {
      // conditional styling
      styles: {
         fill: function(data) {
            if (poverty[data.id] > 0.17) return '#ee4444';
            return '#f0f0f0';
         }
      }
   });
});
Data source:
statehealthfacts.org
Democracy scores in African countries
Data source:
systemicpeace.org
Median household income per county
Data:
census.gov
, Shapefile:
census.gov
Map symbols
var dataset = [
    { city: 'Paris', lat: 48.8667, lon: 2.3333, visits: 130 },
    { city: 'London', lat: 51.5142, lon: -0.0931, visits: 122 },
    { city: 'Berlin', lat: 52.5167, lon: 13.4, visits: 62 },
       // ..
];

map.addSymbols({
   type: Kartograph.Bubble,
   data: dataset,
   location: function(d) { return [d.lon, d.lat]; },
   radius: function(d) { return Math.sqrt(d.visits); },
   tooltip: function(d) {
      return d.city + ' ' + d.visits;
   }
});
Visits on http://kartograph.org
SVG filters, textures, animations
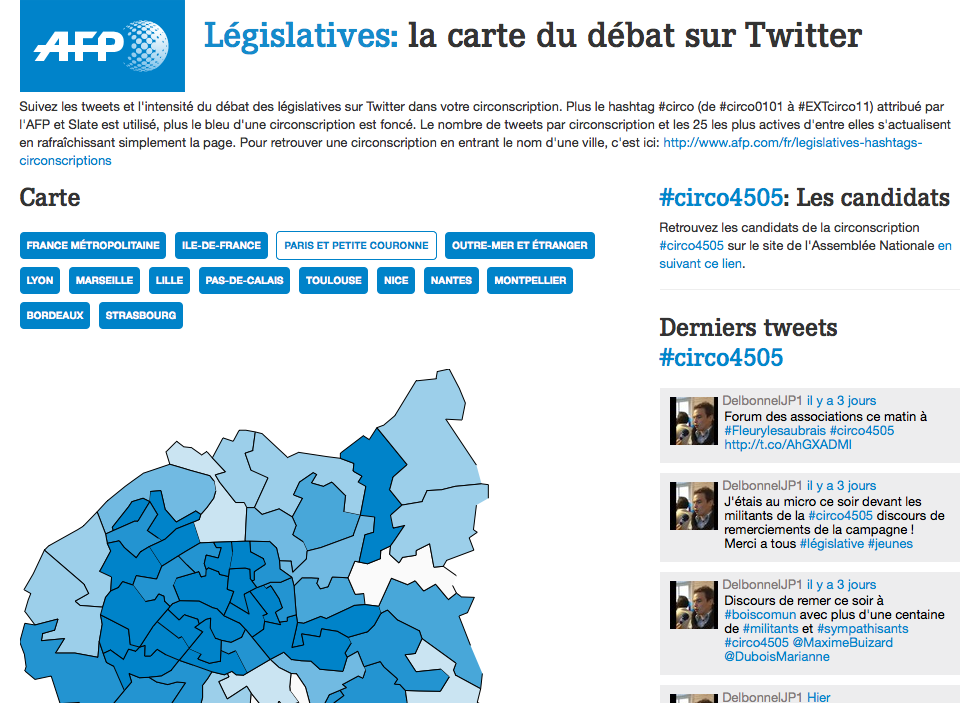
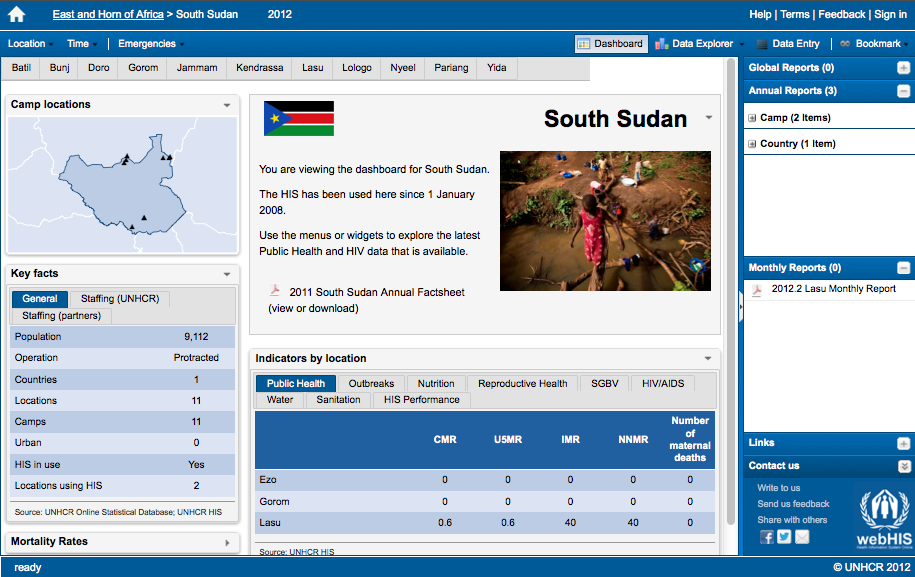
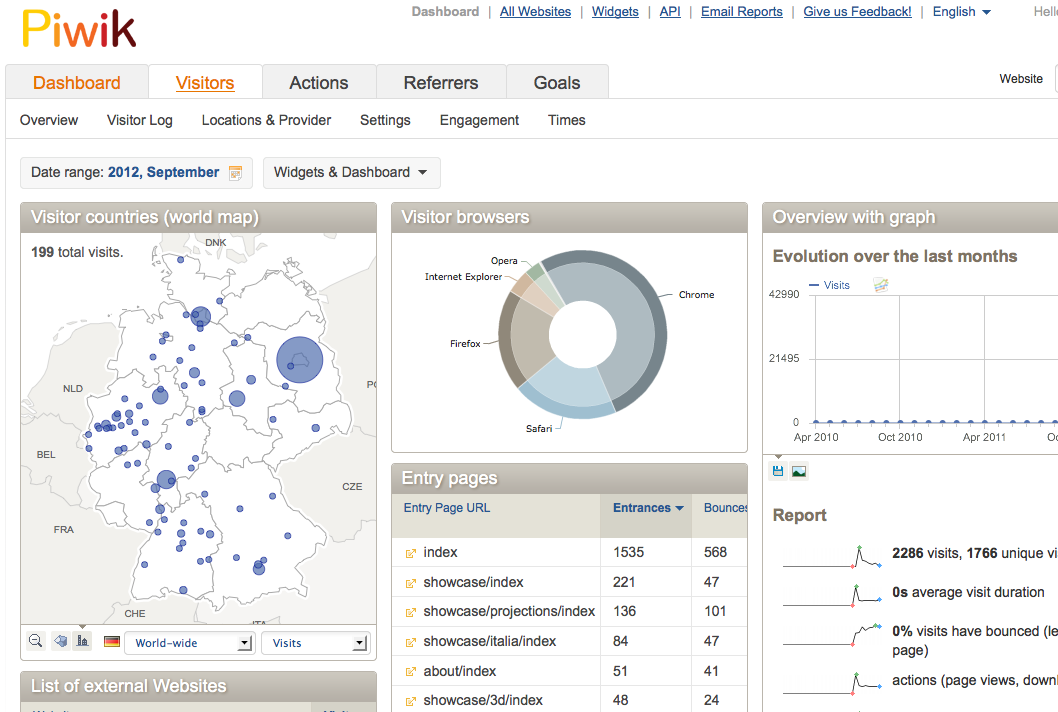
Kartograph in the wild
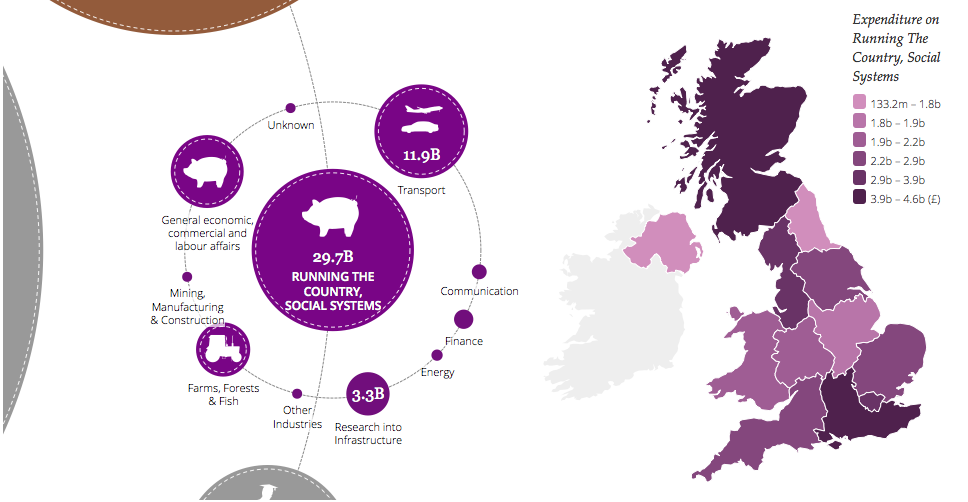
Summary
- Kartograph is a framework for web mapping using SVG
- Designed for visualizing data on simple maps
- SVG markup stores metadata about the coordinate system and the mapped features
- Free software, released unter AGPL and LGPL
- Open for contributions!
Future work
- Multiple projections per map
- Pan & Zoom
- More ancient map projections
- Inverse projection
- Hill shading using SVG filters?
Thank you!
slides.vis4.net/kartograph-svgopen2012
Supporters: