Scale and Performance
in Interactive Data Visualizations
Graphical Web / HTML5devconf / San Francisco, Oct 2013
What's so special about datavis?
We're not just
animating snow flakes
Accuracy matters
position, size, orientation, color
Object constancy
- filtering (adding or removing elements)
- reordering (sorting)
- switching dimensions within multivariate data
- semantic zooming
Examples tend to show
comfortable datasets
Data comes at its own scale
Example #1
Porting Ben Frys
Fortune 500 vis to HTML5
Fortune 500
Original version in Java (Processing)
fathom.info/fortune500"The intent is to show how 84,000 data points could be easily viewed and navigated in an interactive piece."
"The piece uses Java. I spent a few hours on a JavaScript version, but it ran at 3 frames per second (instead of 60; it’s like 1998 again!) It also required a 6 megabyte JSON file for all the data. All likely fixable, but no thanks."
Re-implementation
in JavaScript
lineTo()
ctx.clearRect(0,0,900,650);

for (yr=0; yr < maxYear; yr++) {
    for (c=0; c < companies.length; c++) {
        ctx.beginPath();
        ctx.strokeStyle = profit > 0 ? 'green' : 'red');
        ctx.moveTo(x0, y);
        ctx.lineTo(x1, y);
        ctx.stroke();
    }
}
fillRect()
ctx.clearRect(0,0,900,650);

for (yr=0; yr < maxYear; yr++) {
    for (c=0; c < companies.length; c++) {
        ctx.fillStyle = profit > 0 ? 'green' : 'red');
        ctx.fillRect(x0, y, x1 - x0, 1);
    }
}
putImageData()
ctx.clearRect(0,0,900,650);
var bmp = ctx.getImageData(0,0,900,520);

for (yr=0; yr < maxYear; yr++) {
    for (c=0; c < companies.length; c++) {
        var rgb = profit > 0 ? [0,0,255] : [255,0,0];
        for (var x = x0; x <= x1; x++) {
            var idx = (x + y * 900) * 4;
            bmp.data[idx] = rgb[0];
            bmp.data[idx+1] = rgb[1];
            bmp.data[idx+2] = rgb[2];
            bmp.data[idx+3] = 255;
        }
    }
}
ctx.putImageData(bmp, 0, 0);
lineTo() - version 2
ctx.clearRect(0,0,900,650);
ctx.beginPath();
for (yr=0; yr < maxYear; yr++) {
    for (c=0; c < companies.length; c++) {
        ctx.strokeStyle = profit > 0 ? 'green' : 'red');
        ctx.moveTo(x0, y);
        ctx.lineTo(x1, y);
    }
}
ctx.stroke();
lineTo() - final
ctx.clearRect(0,0,900,650);
for (yr=0; yr < maxYear; yr++) {
    // draw all profit-makers
    ctx.beginPath();
    ctx.strokeStyle = 'green';
    for (...) { ctx.moveTo(x0, y); ctx.lineTo(x1, y); }
    ctx.stroke();

    // draw all loss-makers
    ctx.beginPath();
    ctx.strokeStyle = 'red';
    for (...) { ctx.moveTo(x0, y); ctx.lineTo(x1, y); }
    ctx.stroke();
}
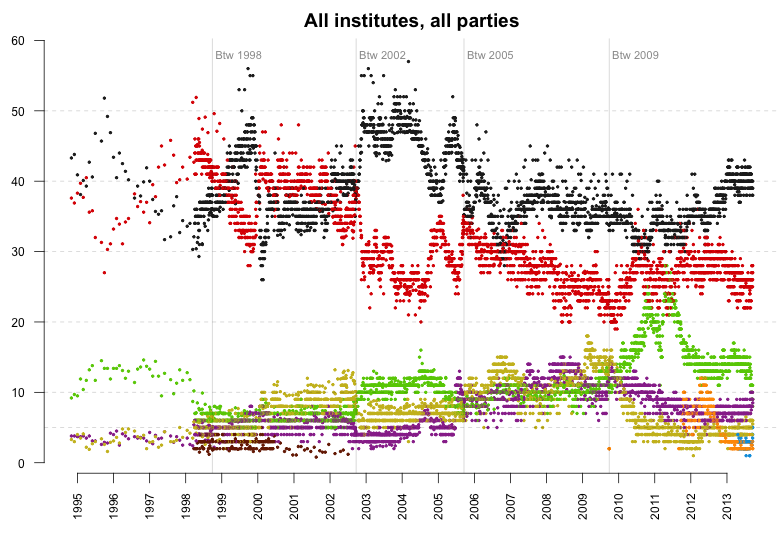
Polling data
Using D3.js
svg.on("mousemove", function() {
    var mouse = d3.mouse(this);
    // update fisheye distortion
    fisheye.distortion(3.5).focus(mouse[0]);

    dots.attr("cx", function(d) { return fisheye(new Date(d.date)); })
        .attr("cy", function(d) { return yscale(d.value); });

    // update axis ticks and grid etc...
});
Using D3.js - translate()
svg.on("mousemove", function() {
    var mouse = d3.mouse(this);
    // update fisheye distortion
    fisheye.distortion(3.5).focus(mouse[0]);

    dots.attr("transform", function(d) {
        return 'translate('+fisheye(new Date(d.date))+','+yscale(d.value)+')';
    });

    // update axis ticks and grid etc...
});
Maybe using CSS transform?
svg.on("mousemove", function() {
    var mouse = d3.mouse(this);
    // update fisheye distortion
    fisheye.distortion(3.5).focus(mouse[0]);

    dots.attr("style", function(d) {
        return '-webkit-transform:translate('+fisheye(new Date(d.date))+'px,'+yscale(d.value)+'px)';
    });

    // update axis ticks and grid etc...
});
Back to Canvas - fillRect
fillRect
for (var i=0; i < polls.length;i++) {
    //...
    ctx.fillStyle = 'rgb('+r+','+g+','+b+')';
    ctx.fillRect(x, y, w, h);
}
Back to Canvas - putImageData
ctx.clearRect(0,0,900,650);
var bmp = ctx.getImageData(0,0,900,520);

for (var i=0; i < polls.length;i++) {
    var rgb = partyColors[polls[i].party];
    for (var x = x0; x <= x1; x++) {
        var idx = (x + y * w) * 4;
        bmp.data[idx] = rgb[0];
        bmp.data[idx+1] = rgb[1];
        bmp.data[idx+2] = rgb[2];
        bmp.data[idx+3] = 255;
}
ctx.putImageData(bmp, 0, 0);
Networks
Using D3.js + SVG
Demorender()
force.on("tick", function() {
    // update edges
    link.attr("x1", function(d) { return d.source.x; })
        .attr("y1", function(d) { return d.source.y; })
        .attr("x2", function(d) { return d.target.x; })
        .attr("y2", function(d) { return d.target.y; });

    // update node positions
    node.attr("cx", function(d) { return d.x; })
        .attr("cy", function(d) { return d.y; });
});
Using D3.js + Canvas
performance is "slightly" better
Demorender()
force.on("tick", function() {
    context.clearRect(0, 0, width, height);

    context.strokeStyle = "#ccc";
    context.beginPath();
    graph.edges.forEach(function(d) {
      context.moveTo(d.source.x, d.source.y);
      context.lineTo(d.target.x, d.target.y);
    });
    context.stroke();

    context.fillStyle = "black";
    context.beginPath();
    graph.nodes.forEach(function(d) {
      context.moveTo(d.x, d.y);
      context.arc(d.x, d.y, 3, 0, 2 * Math.PI);
    });
    context.fill();
});
// TODO: mouse events
click, mouseover, drag and drop
How about 10k nodes?
- Pre-compute graph layout
- Render in Canvas
- or use tiles: Internet Map
Maps
Using D3.js + SVG
DemoRemember the good old days?
graphics.lineStyle(..., LineScaleMode.NONE);
Manually adjusting
stroke widths
Demo
What would the
New York Times do?
Hire an expert!
such as Matthew Bloch and Mike Bostock
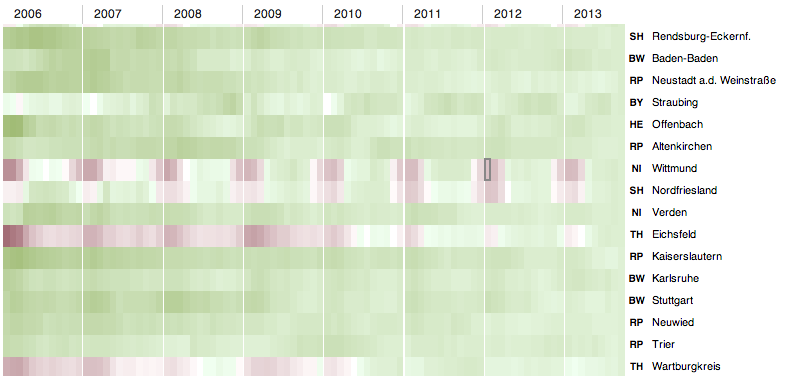
NYT: Where Poor and Uninsured Americans LiveDynamic Simplification
Each point is stored with an additional z-coordinate for the zoom level at which the point shall be drawn.
Efficient data storage: gzipped TopoJSON
Result: incredibly fast loading and rendering, high level of details even when zoomed in closely.
When not to render in the browser
Rendering in the client is awesome, but sometimes is makes more sense to pre-render images.
Example: Unemployment heatmap
Firefox doesn't like
too many DOM nodes!

Why bother the client anyway?
Data changes once in a month
pre-rendering static images
use CSS sprites
Is SVG doomed?
CSS3 transitions to the rescue!
Say good-bye to requestAnimationFrame()
_.each(circles, function(c, i) {
    c.style.WebkitTransition = "all 0.7s ease-in-out";
    c.style.WebkitTransform = 'translate('+ x +'px,'+ y +'px) scale('+s+');';
});
e.g. jQuery.Transit
Take-home messages
Go low level
Read the source code of the libraries you're using!
Try different things
Measure performace in different browsers
Cherry-pick technologies
Canvas, SVG, HTML, CSS, ImageSprites
Mix frameworks!
D3.js + Raphael.js = totally doable
Don't bother the client
(if not necessary)
Big DOM = big trouble
(at least in Firefox)
Use of CSS3 transitions
..and enjoy the power of the GPU
Split up your canvas
Sometimes rendering on multiple (layered) SVG / canvas elements is faster than just using one.
Use Chrome developer tools
CPU profiles, timeline, paint rectangles
Further reading
jankfree.org
some links for those who want to make the web smoother)
How to make fast animated HTML5 visualizations
lesson learned from the OECD Betterlife visualization (highly recommended)
Thanks
by Gregor Aisch